Business processes are the heartbeat of any organization. They are the sequences of tasks that combine to create a product, deliver a service, or achieve a specific outcome. Whether it’s fulfilling a customer order, processing a payment, or integrating data from one system to another, these processes must be efficient, accurate, and robust.
Monitoring these processes is not just about ensuring they’re working right now. It’s about spotting potential problems before they become actual problems. It’s about understanding how things are working and finding ways to make them work better. Monitoring provides a window into the day-to-day operations of a business, allowing for improved decision-making, quicker response to issues, and an overall smoother operational flow.
RACI
Monitoring plays an integral role in maintaining security across various business processes and functions. It can be aptly compared to the ‘I’ in the RACI model. RACI is an acronym that stands for Responsible, Accountable, Consulted, and Informed. These terms denote various roles that individuals or teams can play in a project or process.
The ‘I’ in RACI stands for ‘Informed’. This role is about keeping individuals in the loop about the progress and decisions made in a project. They are the recipients of updates and results, but they do not actively participate in decision-making or actions. Their purpose is to be aware and stay updated about the proceedings. Drawing parallels with monitoring, we can see that just like the ‘Informed’ role, monitoring too aims at keeping relevant parties aware and updated. In the realm of security, monitoring tools and processes continuously track, analyze and report on various aspects of the system or application. These may include network traffic, user activities, system vulnerabilities, unauthorized access attempts, and more.
Just as the ‘Informed’ role does not actively intervene, but keeps a keen eye on the progress, monitoring does not prevent or rectify issues, but reports on them. It provides the much-needed visibility into system operations, flagging potential security threats and anomalies. This information is then used by other parties (comparable to the ‘Responsible’ and ‘Accountable’ roles in the RACI model) to take action as needed.
Therefore, the role of monitoring in security is akin to the ‘Informative’ role in the RACI model. It is about keeping a vigilant watch on the security environment, picking up and reporting any irregularities, thereby facilitating informed decision-making and timely action. Without effective monitoring, there can be a lack of transparency and awareness, which could lead to delayed responses or even missed threats, thus jeopardizing the security framework.
What is Application Map in Application Insights?
Application Insights is a powerful tool that provides in-depth insights into applications’ performance and usage. One of its standout features is the Application Map.

An Application Map is a visual representation of the different components of an application and how they interact with each other. Think of it as a blueprint or a roadmap, showing the various parts of your application, like servers, databases, external services, etc., and the connections between them.
For business processes, especially those involving integration, this map is vital. It provides a clear, easy-to-understand view of how different parts of the process are linked. This visual guide helps in identifying bottlenecks, failures, or performance issues in the system, facilitating quicker resolutions and optimizations.
Using an Application Map in Application Insights doesn’t just help with troubleshooting. It offers an overall view of the process, assisting teams in understanding how their applications function and where improvements or adjustments might be needed. It’s about proactive management rather than reactive fixing.
How to enabling Application Insights
Enabling Application Insights is a straightforward process that can be incorporated easily into many Azure services and programmed into various languages. This process offers significant advantages, such as deep diagnostics, interactive metrics, and intelligent detection of anomalies in applications. Here’s a simple explanation of how you can set up Application Insights out of the box for Azure services and how you can integrate it via code.
Enabling Application Insights in Azure Services
For many Azure services, the process to enable Application Insights is rather simple and is usually done through the Azure portal.
Let’s take Azure App Services as an example:
- In the Azure portal, navigate to the App Service you want to monitor.
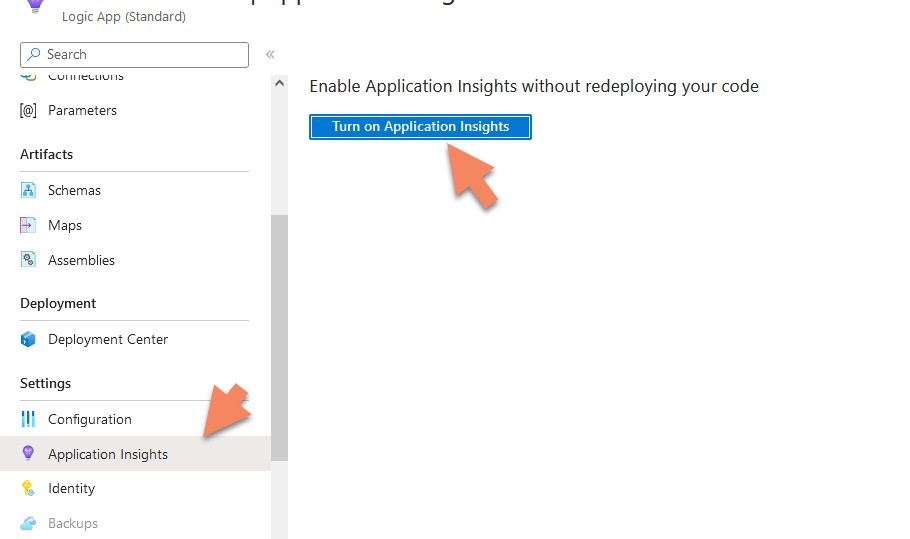
- In the left navigation pane, under the ‘Monitoring’ section, select ‘Application Insights’.
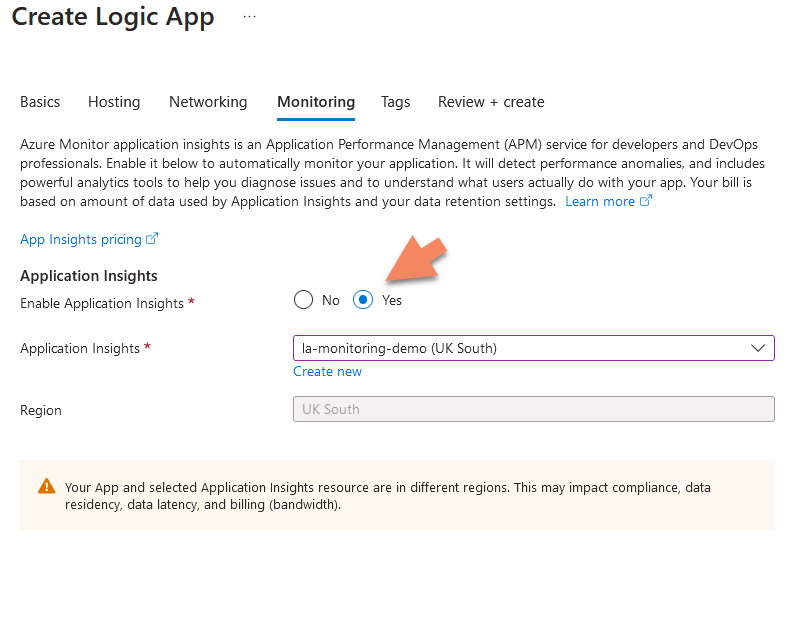
- Turn on the Application Insights, and either select an existing resource or create a new one.
- Click on the ‘Apply’ button to save your settings.
In a similar fashion, you can enable Application Insights for other Azure services such as Azure Functions, Azure Logic Apps, and others. Remember, the specific steps may vary slightly depending on the service.
Integrating Application Insights via Code
Application Insights can also be incorporated into the code of your applications, offering developers the ability to monitor applications in real-time, regardless of the environment they’re running in. Application Insights SDKs are available for multiple languages, including .NET, Java, JavaScript, Node.js, and Python.
Adding Application Insights to a .NET Core application:
First, you need to add the Application Insights SDK to your project. In your .NET Core application, add the NuGet package Microsoft.ApplicationInsights.AspNetCore:Use the Package Manager Console in Visual Studio and run this command:Install-Package Microsoft.ApplicationInsights.AspNetCore
Or, if you prefer .NET CLI, use this command:dotnet add package Microsoft.ApplicationInsights.AspNetCore
Next, in the Program.cs file of your application, in the CreateHostBuilder method, add .UseApplicationInsights()
public static IHostBuilder CreateHostBuilder(string[] args) =>
     Host.CreateDefaultBuilder(args)
         .ConfigureWebHostDefaults(webBuilder =>
         {
             webBuilder.UseStartup<Startup>().UseApplicationInsights();
         });
Finally, you will need to add your Instrumentation Key in your appsettings.json file as below:
{
  "ApplicationInsights": {
    "InstrumentationKey": "your-instrumentation-key"
  }
}
Replace "your-instrumentation-key" with the Instrumentation Key you got from Azure.
That’s it! Now your .NET Core application is configured to use Application Insights. All the telemetry data from your application will be sent to the Application Insights resource specified by your Instrumentation Key.
You can monitor the performance, exceptions, dependencies and more from your application in real-time using Azure’s Application Insights tool.
Remember to import the required namespaces wherever necessary:
using Microsoft.ApplicationInsights;
using Microsoft.ApplicationInsights.DataContracts;
Managing Application Insights
Managing Application Insights resources efficiently is crucial for monitoring your applications in Azure. Using a common Application Insights instance for all components can provide a unified view of telemetry across your entire application. However, depending on the size and complexity of your application, there may be scenarios where using separate Application Insights resources for different components might be beneficial. Here’s a strategy to consider:
- Common Application Insights for Microservices: If your application is composed of multiple microservices, it’s often advantageous to set up an Application Insights instance for each microservice. This enables you to get detailed telemetry data for each service independently, which can be extremely useful when diagnosing issues.
- Separate Application Insights for Environments: It’s typically recommended to have separate Application Insights resources for different environments like development, testing, and production. This segregation ensures that telemetry from one environment does not influence the data of another.
- Consolidation: In some scenarios, you might want to consolidate data from multiple Application Insights resources. For example, if you’re working on a large application with multiple teams, each team might have their own Application Insights resource. You could create a single Application Insights resource where all this data is consolidated, providing a unified view across teams.
- Filtering and Views: Using Azure Monitor Views, you can create custom dashboards that filter and present your telemetry data in ways that are most useful for your specific needs. You can create different views for different roles, teams, or purposes.
- Retention and Cost: Bear in mind that the volume of telemetry data can impact the cost of Application Insights and data retention periods. If your application generates a large volume of telemetry, consider strategies like sampling or pre-aggregation to reduce volume and cost.
Always consider these factors and choose the approach that best suits your specific needs and scenarios. Proper organization of Application Insights resources can significantly improve the monitoring and diagnostic capabilities of your applications in Azure.
For more detailed guidance on managing and organizing your Application Insights resources, the official Microsoft Azure documentation is a great resource. Please find the link below:
Azure Monitor- Application Insights – Documentation
This page provides a comprehensive overview of Application Insights, including its capabilities, how to use it, and best practices for organizing and managing your Application Insights resources.
Demo
I’ve developed an example where I simulate an integration process between various Logic Apps. I’ve also used Azure API Management (APIM).
I’ve integrated the various components into Application Insights in seconds by simply enabling the same Application Insights instance and associating it with all of them.
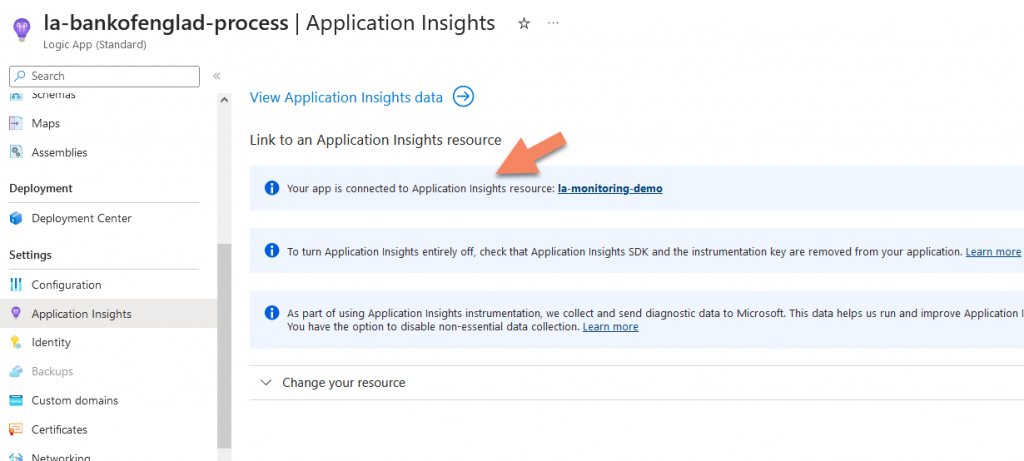
During the creation of an Azure component, we have the option to link it with the Application Insights component, and The same procedure can be applied to almost any Azure component.
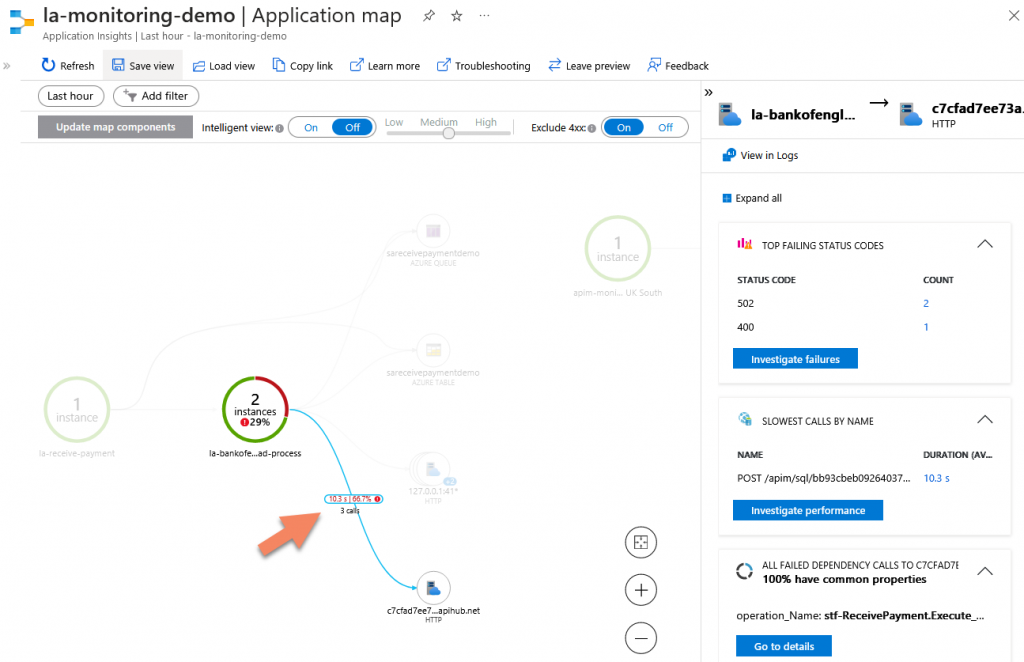
Using Postman, I sent a message and caused an error when inserting into the SQL database. The Application Map then created a visual representation of this process. [Image will be inserted here] As you can see, the Application Map has laid out the entire process.
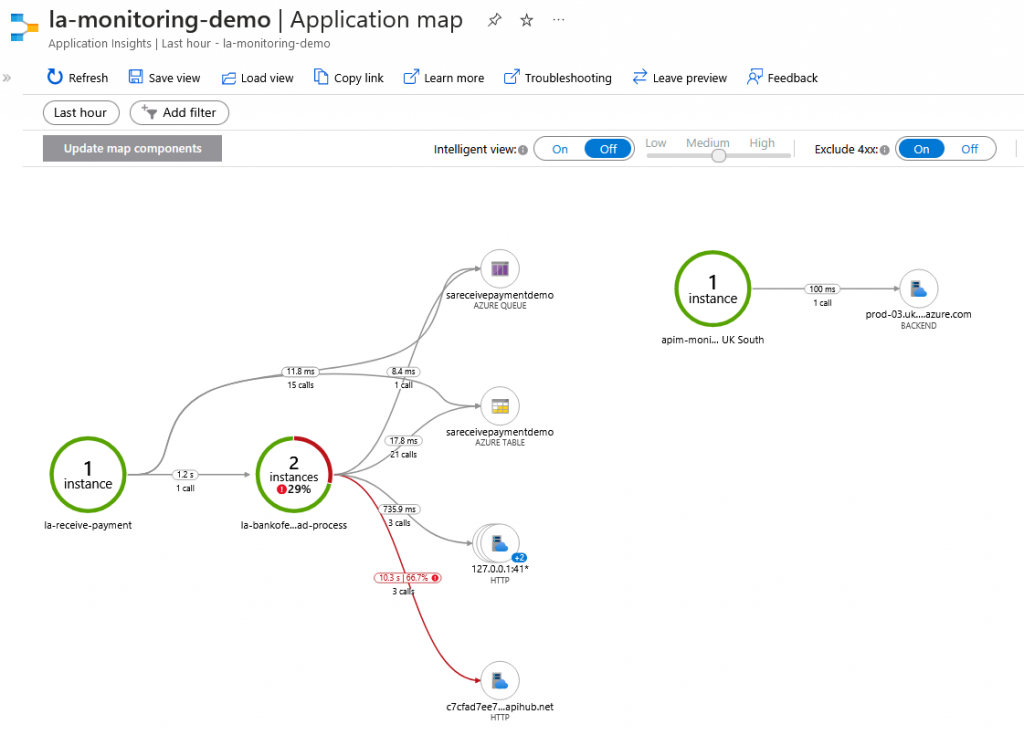
Now, I can go into detail about the various errors, which are clearly marked in red.
I can dive deeper into each error.
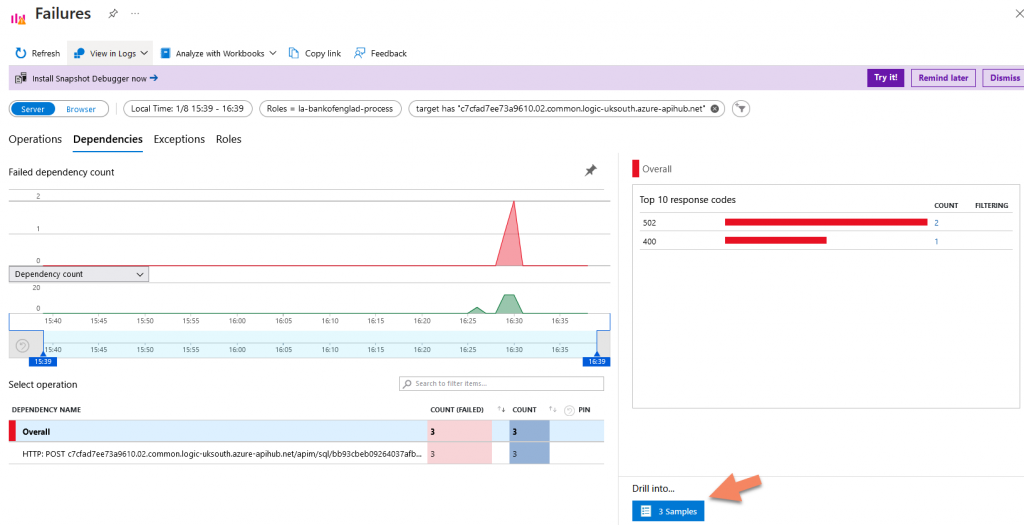
I can navigate in any error and step
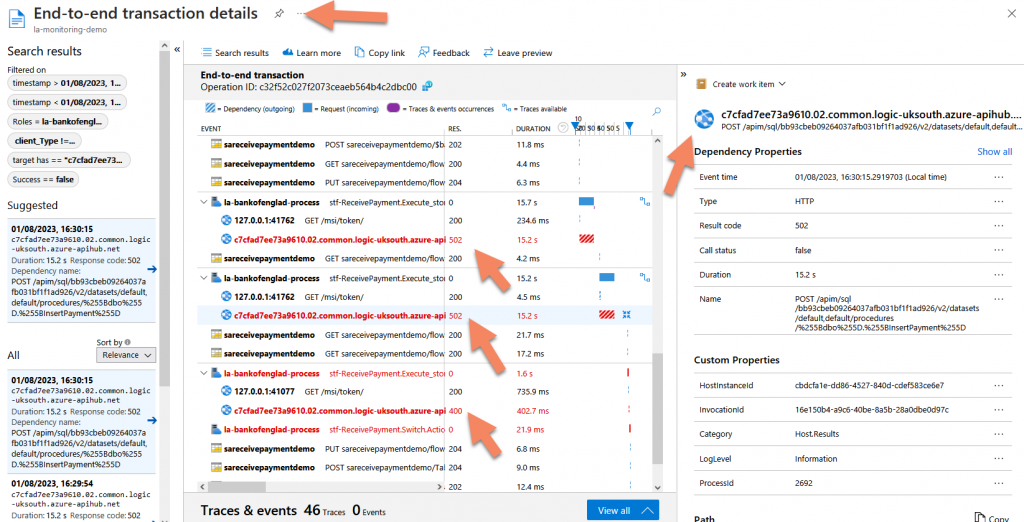
I can immediately switch in the deepest trace level.
I can also investigate performance details to see if there are any bottlenecks.
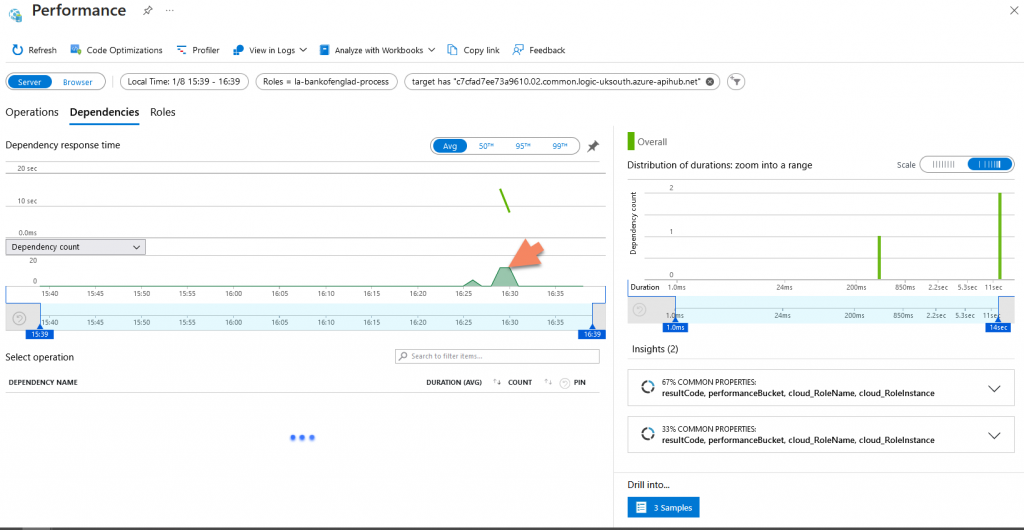
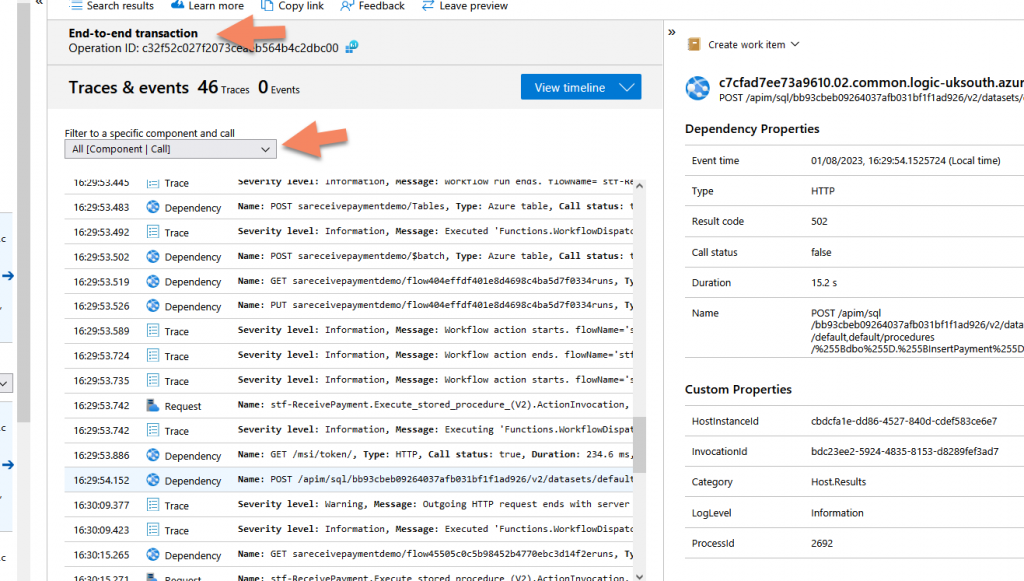
I can look into all the process dependencies in more detail, and I have the ability to immediately view the entire detailed trace or filter it for a specific component.
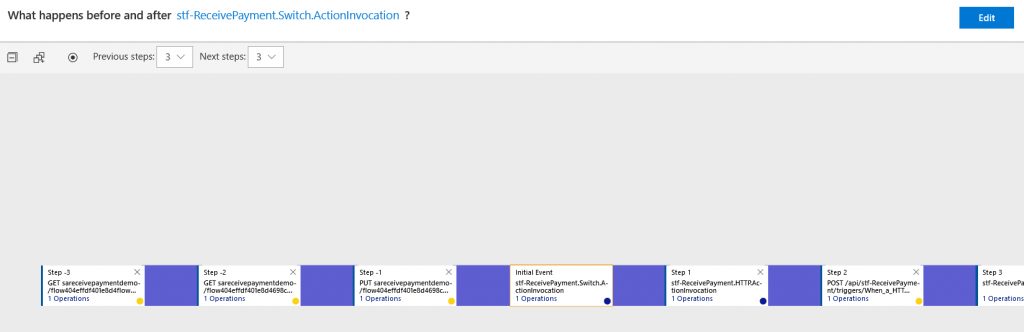
One feature I love is the ability to see in detail what happened before and after a certain point in the process.
In this exploration of Business Activity Monitoring (BAM) and its implementation through Azure’s Application Insights and Application Map, we’ve only skimmed the surface of its potential. The effectiveness and efficiency of Application Map in enhancing your application’s visibility, debugging, and performance are truly remarkable.
Tracking Messages
Monitoring messages is a frequently requested activity in Business Activity Monitoring. However, due regard must be given to regulations such as GDPR. The General Data Protection Regulation (GDPR) has been put in place to ensure the privacy of individuals, and it outlines strict rules about how personal data is collected, stored, and used. Any activity involving storing and tracking message content could potentially involve handling sensitive personal data, and hence must comply with the GDPR regulations. This means you need to ensure the right security measures are in place, such as encryption, and have explicit consent from the individuals whose data you’re processing.
You can learn more about GDPR regulations here.
Application Map doesn’t store any message content due to security and compliance reasons, but it can be seamlessly integrated to track messages. Application Map uses certain properties to track processes. Some of the key properties used by Application Map for tracing include operation_Id, operation_ParentId, and request_Id among others. For more details, you can refer to this documentation.
To track messages, you can create a custom ‘MessageID’ property within the message context.
The ‘MessageID’ property can then be used to link the messages with the corresponding telemetry data in Application Insights.
A simple payload message example will look as below:
{
    "header": {
        "transactionId": "123e4567-e89b-12d3-a456-426614174000",
        "timestamp": "2023-07-28T15:00:01Z",
        "messageId": "550e8400-e29b-41d4-a716-446655440000"
    },
    "body": {
        "paymentId": "pay-0022",
        "customerId": "cust-789",
        "amount": 50.00,
        "currency": "USD",
        "paymentMethod": "CreditCard",
        "paymentToken": "tkn-8n389n098n234",
        "transactionDate": "2023-07-28T15:00:00Z",
        "status": "Completed"
    }
}
For storing the messages, you have several options. However, when considering performance and cost, Azure Blob Storage and Azure Table Storage are commonly used due to their scalability, security, and affordability.
To save messages in Azure Blob Storage, you can use the properties of the message, such as ‘MessageID’, as the blob name. This allows you to quickly retrieve messages when needed. Blob Storage also supports various levels of access and security to ensure that your data is secure.
This is a very simple
Saving a message in Azure Blob Storage is a straightforward process when using Azure Logic Apps. This is made possible by the built-in connector for Blob Storage provided within Logic Apps. With just a few clicks, you can easily set up an action to save your messages directly to Blob Storage, making it an accessible and user-friendly solution for your storage needs.
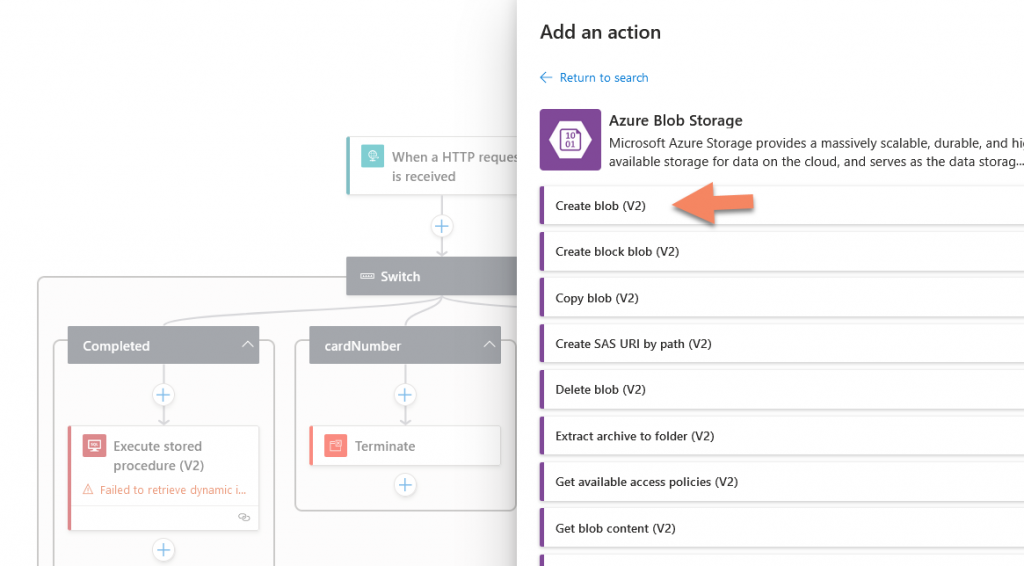
You can find more information on how to use the Azure Blob Storage connector in Logic Apps from Azure Logic Apps and Azure Blob Storage.
Integrating Azure Blob Storage with Azure Functions is also quite straightforward.
Azure Functions provides output bindings that you can use to write data to Azure Blob Storage, below an example you can directly use.
using System.IO;
using Microsoft.AspNetCore.Mvc;
using Microsoft.Azure.WebJobs;
using Microsoft.Azure.WebJobs.Extensions.Http;
using Microsoft.AspNetCore.Http;
using Newtonsoft.Json;
using System.Threading.Tasks;

public static class SaveToBlob
{
    [FunctionName("SaveToBlob")]
    public static async Task<IActionResult> Run(
        [HttpTrigger(AuthorizationLevel.Function, "post", Route = null)] HttpRequest req,
        [Blob("messages/{messageId}.txt", FileAccess.Write, Connection = "AzureWebJobsStorage")] TextWriter outputBlob)
    {
        string requestBody = await new StreamReader(req.Body).ReadToEndAsync();
        dynamic data = JsonConvert.DeserializeObject(requestBody);
        string messageId = data?.header?.messageId;

        if (string.IsNullOrWhiteSpace(messageId))
        {
            return new BadRequestObjectResult("The messageId must be provided in the message header.");
        }

        await outputBlob.WriteAsync(requestBody);
        return new OkObjectResult($"Message with Id {messageId} has been saved to Blob Storage.");
    }
}
The Azure Function reads the incoming HTTP request, parses the JSON to extract the messageId from the message header, and then writes the entire message to Azure Blob Storage with the messageId as the name of the blob.
Replace "AzureWebJobsStorage" with the name of your actual connection string setting, and this should be stored securely, preferably in Azure Key Vault.
Please keep in mind that you cannot track any data in the message.
As I mentioned before, GDPR has specific guidelines on what types of personal data should not be included in any form of storage or processing without explicit, informed consent from the individual.
Personal data refers to any information relating to an individual who can be identified, directly or indirectly, by that information.
This can include but is not limited to:
- Identifiers: Such as name, identification number, location data, IP address, or any online identifier.
- Sensitive Data: This category of personal data includes racial or ethnic origin, political opinions, religious or philosophical beliefs, trade union membership, genetic data, biometric data, data concerning health, or data concerning a natural person’s sex life or sexual orientation.
In the context of message content, this would mean that any of the above types of information should not be included without the individual’s explicit consent. Furthermore, if you do have consent to store and process this type of information, it should be stored and processed in a secure way that complies with GDPR requirements, such as encryption.
If any personal data is included in the message content, it must be protected and handled according to GDPR guidelines. This means ensuring data minimization (only collecting what is necessary), limiting access to the data, and implementing strong security measures.
In conclusion, while Application Insights Application Map doesn’t directly support message content tracking, it provides you with the tools and flexibility to design your own message tracing solution. By leveraging Azure’s powerful storage services and the custom properties in Application Insights, you can build a robust and scalable solution for tracking messages in line with GDPR regulations.
Remember that any solution should prioritize the security and privacy of user data, providing only the necessary levels of access and protecting data with encryption wherever necessary.
Application Map offers an uncomplicated yet insightful overview of your applications, showing the connections and dependencies, and uncovering any existing or potential bottlenecks.
It presents errors and performance issues clearly, making troubleshooting a breeze.
And remember, what I’ve demonstrated here can be applied to nearly any Azure component, making this tool remarkably versatile.
However, this is just the tip of the iceberg. There’s a wealth of knowledge and functionality still to discover about Application Insights, Application Map, and their contributions to BAM.
Here are some excellent resources you can tap into:
Official Microsoft Documentation on Application Insights
Working with Application Map (Microsoft)
Improving performance using Application Insights
Creating custom telemetry with Application Insights
Harnessing the power of Application Map and the broader capabilities of Application Insights can substantially enhance your ability to monitor, manage, and optimize your business processes.