These are some quick notes to fix some of the major issues quickly.
The Elastic Search Cluster (ESC) is not responding
To test this issue, log into the ESC into the load balancer IP and port 9200, the address should be like below:
- http://10.10.0.5:9200
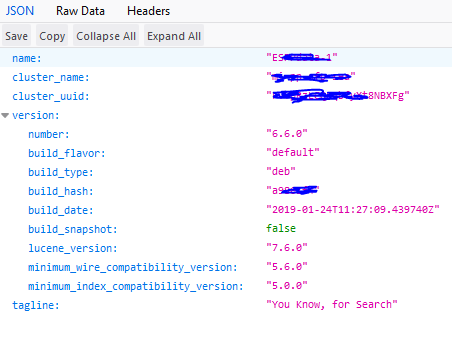
At the user prompt enter, the username and password and you should receive a response like below

If not the restart the ESC in this order:
- Stop all nodes
- Start the Data-X nodes
- Start the Master-X nodes
- Start the Kibana node
Retry to log into ESC.
ESC also responds to the 5601 port on the Kibana node; the URL should be like below:
- http://10.0.0.5:5601/app/kibana#/home?_g=()
It is important to know that the Kibana admin portal and the cluster data search are not correlated. I mean that the admin portal can be up, but the data nodes are not reachable by the app.
If you are using ESC from another Web app, then try to ping the ESC as below:
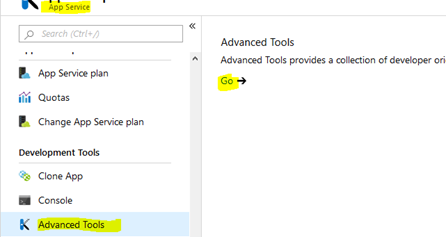
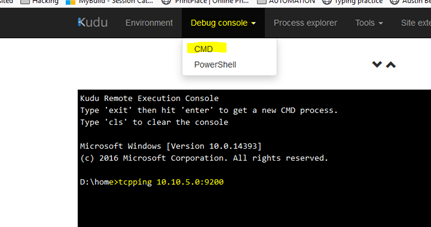
- Enter in the App Service and open the Kudu console

- Execute a tcpping of the internal load balance:

If you don’t get any reply then restart the ESC as previous instructions, most of the time it solves the problem.

